


Are PLG companies more efficient and valuable than SLG companies?
Here is an in-depth data analysis of PLG vs SLG companies to determine valuation multiples, ARR efficiency, and correlation between different SaaS metrics using publicly available data.


Since the early days of Atlassian, we had a raging debate. How much should our revenues grow annually, and at what costs? Does PLG or SLG make a difference? You could easily buy your way to growth, and you pay that price with profitability. I have seen many CEOs and founders struggle with these questions.
I have been asking those same questions for quite some time. I have been trying to find some data sets to play around with and accidentally landed on this gold mine from Meritech Capital. It contains publicly available data for post-IPO SaaS companies. But it doesn’t segment the data by GTM motion: PLG, SLG.
I had to do that manually. I visited every single company website and checked their primary call-to-action - the ones with “free trial” or “get started for free” were categorized as “PLG” motion.
Valuation Multiple - is it different for PLG vs SLG?
My first question was primarily about Valuation Multiples. Are investors valuing PLG companies more?
The way I defined Valuation Multiple = Enterprise Value/Implied ARR.
[Note: the data I used was pulled earlier in Jan.]

First and foremost, 4 of the 5 top valued companies are PLG companies:
Snowflake - 21.2
Cloudflare - 15.1
GitLab - 14.8
Paycom - 13.6
Datadog - 13.6
And note all four PLG companies are in the Dev Tools space.
But there is no correlation between GTM motion and Valuation Multiples as you can see in the graph. You can notably argue that above the median (around ~7) there is an equal number of PLG and SLG companies.
To be doubly sure, I segmented the companies by GTM motion, added up their Enterprise Value, and Implied ARR to calculate the overall Valuation Multiple of “SLG only” and “PLG only” companies:
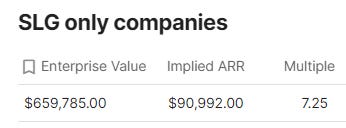

The Valuation Multiples are the same for PLG and SLG = 7.25So, if your implied ARR in 2022 was ~$200M, your current valuation based on the above multiple is ~$1.45B. Figma lucked out with a $20B exit and a 50x ARR multiple.
What influences Valuation Multiple the most?
So, I started playing around with the different variables and the ones which had the most impact on the Valuation Multiple irrespective of their GTM motions:
Rule of 40 - correlation factor of 0.65
(Rule of 40 - the principle that a software company's combined growth rate and profit margin should exceed 40%)Payback Period - correlation factor of 0.47
(Payback Period - the amount of time it takes to recover the cost of an investment)New ARR Efficiency (Net New ARR/S&M spend) - correlation factor of 0.12
(New ARR Efficiency - $ in new ARR for every $1 in S&M spend)

The graph is sorted by Valuation Multiple in ascending order from left to right. The top 5 with the highest Rule of 40 were:
Bill.com - 98% (Valuation Multiple - 12)
Snowflake - 86% (Valuation Multiple - 21.2)
Datadog - 85% (Valuation Multiple - 15.1)
Crowdstrike - 82% (Valuation Multiple - 10)
ZoomInfo - 79% (Valuation Multiple - 10.1)
You can see the inverse correlation of the Valuation Multiple with the Payback Period below. The graph is also sorted by Valuation Multiple in ascending order from left to right:
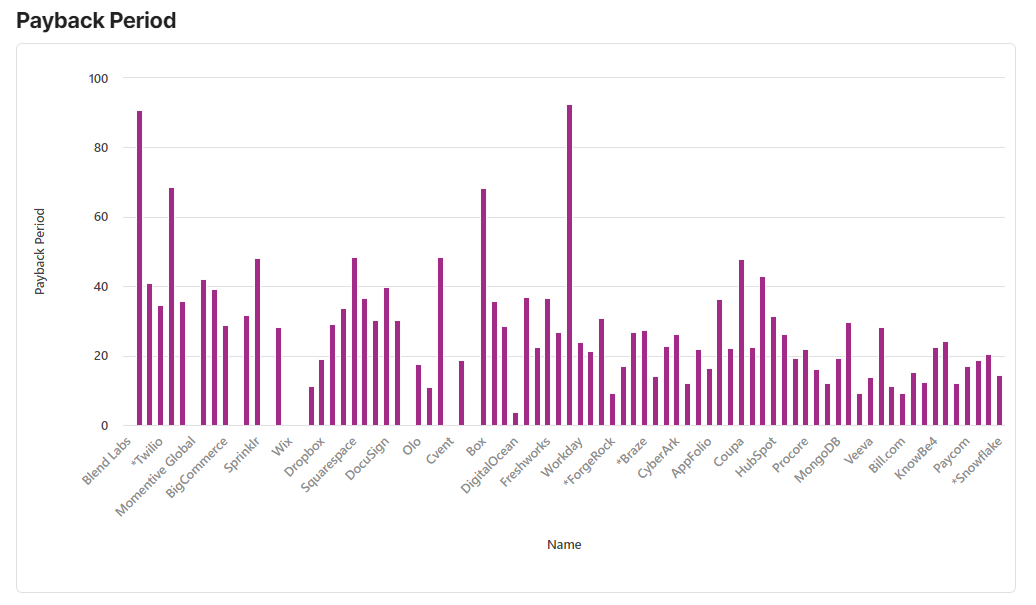
"Rule of 40" is the most important SaaS metric for Valuation MultipleThe correlation of Net New ARR Efficiency ith Valuation Multiple was not very high - a meager 0.12. Some investors expect the Net New ARR efficiency to be one or higher. But looking at publicly available data, there was only one company, Digital Ocean, with an NNAE score of 1.25. The average for the entire PLG family is 0.17. So for every $1 in S&M spent, you get $0.17 in Net New ARR.
Correlation between YoY% growth and S&M spend %
I've been trying to find an answer to this question since the beginning of time. Why is Confluence not growing more than 40% YoY? My response has always been: "we sure can if we are willing to spend more in S&M." You will see the details later - my finding was:
For every $1 in S&M spent, you get "$0.11-$0.17" in net new ARR and "$3.13-$3.17" in ARR.
First looking at SLG companies together (left to right in ascending order of Valuation Multiple):

Average YoY% growth = 34%
Average S&M spend as a % of revenue = 35%
vs PLG companies (left to right in ascending order of higher Valuation Multiple):

Average YoY% growth = 40%
Average S&M spend as a % of revenue = 41%
Interestingly, the PLG companies on average spend more on S&M but also grow at a faster pace.
From a correlation perspective, it was clear there is some correlation between YoY% growth and S&M spend %, especially for PLG companies. (The SLG companies graph seems all over the place.) I even put the values in a spreadsheet and the correlation factor was around ~0.4, after removing some of the data anomalies.
There is a positive correlation between YoY% growth and S&M Spend % for PLG companiesHow efficient are PLG companies vs SLG companies?
First, let me define what each of the variables means in the table:
Enterprise Value = Combined Enterprise Value of (SLG or PLG) companies
Implied ARR = Combined ARR of (SLG or PLG) companies
Valuation Multiple = Enterprise Value/Implied ARR
S&M Spend = Combined S&M spend of (SLG or PLG) companies
Net New ARR = Combined Net New ARR of (SLG or PLG) companies
New ARR Efficiency = Net New ARR/S&M Spend
ARR Efficiency = Implied ARR/S&M Spend
Average YoY% growth of (SLG or PLG) companies
Average S&M Spend % of Revenue of (SLG or PLG) companies
Average Opex Spend % of Revenue of (SLG or PLG) companies


I was pleasantly surprised to discover that the Valuation Multiple and ARR Efficiency of PLG and SLG companies are the same. I double-checked and triple-checked my math.
I have a hypothesis about why the efficiency scores are similar. We are looking at publicly traded SaaS companies selling to the enterprise. PLG companies, as they scale and move up-market, adopt SLG-like selling strategies and are not PLG companies in the truest sense. Hence the eerie similarities in the numbers.
The PLG companies have higher New ARR Efficiency scores and grow at a faster rate than SLG companies, but at the same time spend more on sales and marketing.
PLG Companies are neither more nor less efficient than SLG companies at scale[Huge shout out to the Coda team for building an incredible product - they don't get the credit they deserve. I copied the data from Meritech Capital and then used a Coda doc to generate most of the charts and analyze the data. It was very simple to use.]